I’ve been using Grafana at work for the last five years absolutely love how simple it was to set alerts on dashboards and also template them so it displays nice and concise alerts to Slack.
Here are some alerts I’m familiar with. This is out of the box, the alert just has a rule name and a condition.
So when I come around to adding monitoring to my personal server I went with Grafana but I made a grave mistake of using a much newer version and to my surprise, the alerts are absolute shitshow!
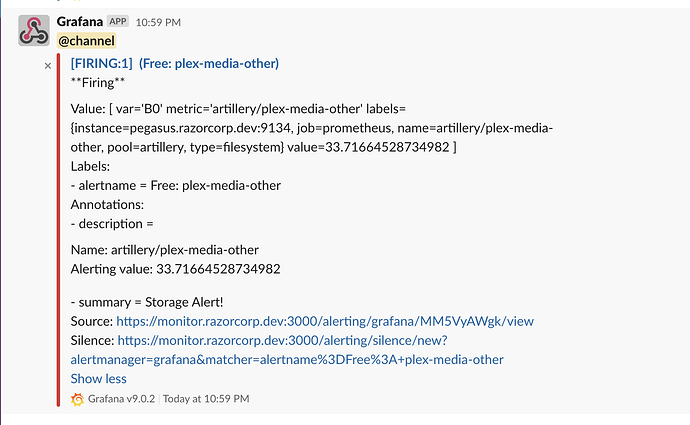
What is even this? This is what it looks like after trying to decipher what’s going on in this community post. https://localhost:3000/t/how-to-use-alert-message-templates-in-grafana/67537
How is this got changed to rocket science? Is my only hope to use the v6 to avoid this mess? Does anyone know how I can clean up this alert?
All I want to see in this alert is:
Name: artillery/plex-media-other
Alerting value: 33.71664528734982
So far I’ve failed to find any useful documents that would help me do that.
Ps: I apologise for my rambling/language, it just drives me absolutely insane when companies go ass backwards to make something that was already working a nightmare to deal with.

