Hello,
I have installed 8.1.2 and moved to the ngalert alerting so can get metrics sent out within the alert email BUT I have an issue with alerts not firing; if the timings are set Evaluate = 1m and for = 1m30s it fires after or around that period of time but if the timings are set to anything bigger they go into pending state - wait for the eval period to finish then add another of the same into pending state, when the next eval period happens it then drops the older pending from pending and adds a fresh one.
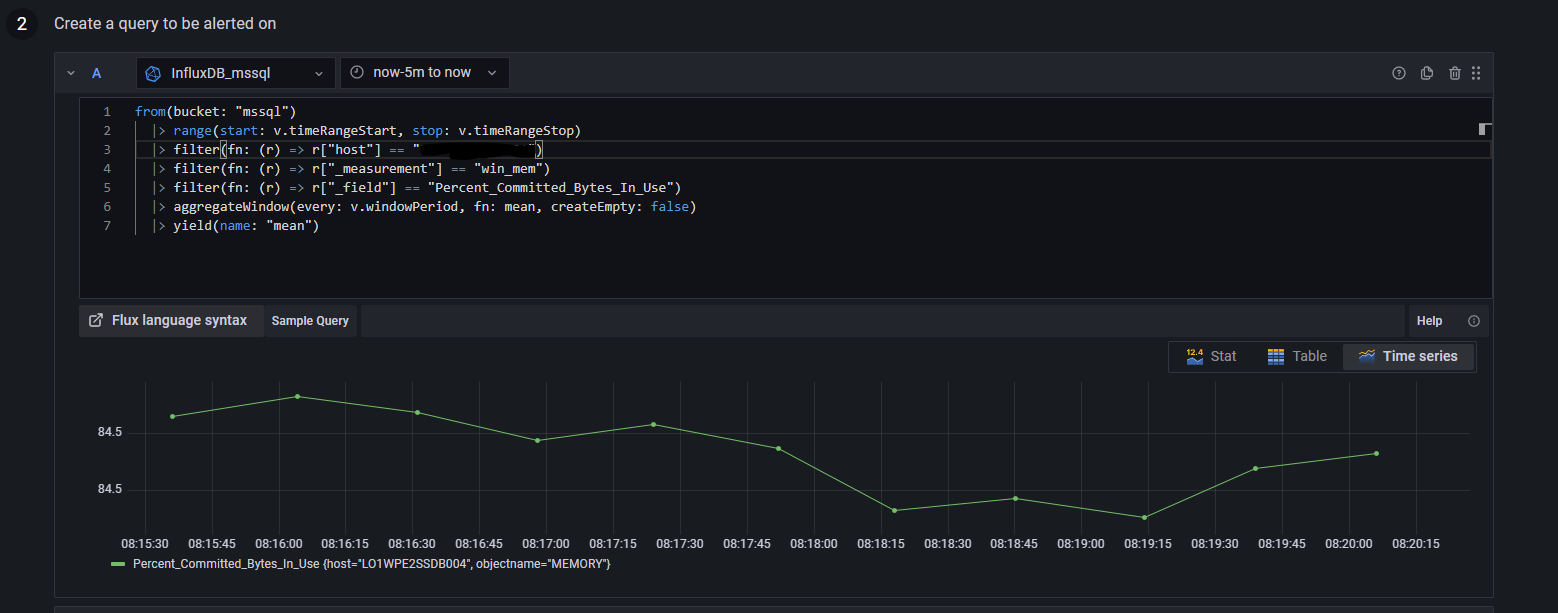
The query is monitoring memory on a single server - Added the screen grabs of what is happening below:
Can anyone tell me whats going on with this as its proper melting my head 
As you can see for the pic above there are 2x pending for the same server and these just rotate
Any help with this esp if I am not understanding how this works would be greatly received
With Grafana v8.2, we are struggling at the same place. (@stuartpelton ) Did you find any solutions?
Just in case this is still a topic:
The behavior is caused by the used labels. The alert includes the label values to calculations. If the label changes, the alert jumps back to pending, even if continuous values are below/above limits.
For us, moving the values from labels to text content solved the issue.
@gn0m3r4l apologies for the late reply, yes I came to the same conclusion, the metric changed so created a new alert.
I am facing the same issue .It would be great if you can explain the solution in details. Especially, what it means to “moving the values from labels to text content solved the issue.”
Most of my alerts are having custom labels too. I tried to re-configured the labels with unique name but was not helpful.
also, am using the latest version of grafana - 9.2.2.
Hi @prabhat8ranjan,
He wanted to say that you should never put metrics into labels (check label Value in his last picture) because they change at every alert evaluation interval (based on query). Every time metric in label changes grafana creates new alert and starts to monitor it. At next evaluation Value label will probably have different metric (e.g. Value=85.12345 ) value (which would start new alert in pending if threshold is met) and then previous alert (with let’s say Value=83.6788) would be closed as Normal(missingSeries) because there is no anymore alert with that specific label (Value=83.6788).
You can solve that problem by moving metrics from labels to annotations like on next picture.
Bonus:
You can round up metrics to whole numbers :
{{ printf "%.0f" $values.B.Value }}
or specific number of decimals with:
{{ printf "%.2f" $values.B.Value }}
Best regards,
ldrascic
Thanks for the update.
This is bit strange!
I need alerts to be fired whenever a threshold limit is crossed and grafana should send me the breach value rather than waiting for the re-evaluation. Rite now, I have used the summary field to get the values in my middleware app.
Additionally, facing below issues .
- Alert is in continuous firing mode. -
Expect it to go in normal mode post check and re- evaluate it as per the evaluation period.
- Event based alerting - Expect to fire alert on triggers/events and is independent of evaluation behavior.

Hi, i have a few servers that alert on memory use, I had issues initially where the alert would constantly fire this was down to having the value set how you have it set. with the value constantly changing it will fire for each change when it checks it as its different.
I have moved the value label into the summary and description like this rather than having its own tag:
The Server(s) {{ $values.B.Labels.host }} are low on memory as only {{ printf “%.0f” $values.B.Value }} MB Free please investigate the cause
try that and remove the value tag from your main tags and test again
i did add the value in the summary section itself. is this incorrect or need to be formatted further?
What is “main tag” here?
B refers to whatever the “Reduce” query value is.
so mine are
“The Server(s) {{ $values.B.Labels.host }} are low on memory {{printf “%.0f” $values.B.Value }} MB Free please investigate the cause”
so then that sends the hostname and the value
I dont know what your queries are so i cannot comment on which it should be (also looks like a diff version of grafana that i used)
Hi @prabhat8ranjan,
Instant trigger (or no peding state) can be achieved if you set Evaluate every: <value> for 0s. Check Prometheus understanding the delays on alerting under title The Alert Lifecycle.
Can you give us more information about your query, especially what time range and function you use? Also, what is the threshold? Can you share picture of CPU usage of that node and mark time where you expected that alert goes back to normal state?
For example, if you use 1h time range with mean function then the output would be very stable number (it won’t change much if CPU goes from 100% to 0% for last few data points) and thus alert won’t go to normal state if after few data points CPU goes back to values above threshold.
Best regards,
ldrascic
@idrascic the use of {{ printf “%.0f” $values.B.Value }} is that able from a specific version of Grafana? it does not seem to work within 8.1.2