alpiua
December 20, 2021, 4:33pm
1
Hello.
We are using grafanaVersion 8.3.3 (commit: 30bb7a93ca, branch: HEAD)
From few days ago we start receiving a lot of errors in the logs similar to:
t=2021-12-18T23:59:04+0200 lvl=eror msg=“Exemplar query failed” logger=tsdb.prometheus query=“sum (app_status_value{host="host",name="component"})” err=“client_error: client error: 404”
About 30-40 messages every 5 seconds from active dashboards.
Due to abnormal log increasing the only way to prevent host from stopping was to exclude error output for that logger with the filterfilters = tsdb.prometheus:critical
Can we do something to get rid of this errors without disabling logger ?
alpiua
December 20, 2021, 4:42pm
2
upd: found the same issue on the github
opened 07:42AM - 20 Dec 21 UTC
<!--
Please use this template to create your bug report. By providing as much i… nfo as possible you help us understand the issue, reproduce it and resolve it for you quicker. Therefore take a couple of extra minutes to make sure you have provided all info needed.
PROTIP: record your screen and attach it as a gif to showcase the issue.
- Questions should be posted to: https://localhost:3000
- Use query inspector to troubleshoot issues: https://bit.ly/2XNF6YS
- How to record and attach gif: https://bit.ly/2Mi8T6K
-->
**What happened**: After my grafana upgrade from 7.0.3 to 8.3.3, printed a lot of error logs. What is the reason
**What you expected to happen**:
From the interface, the data is out, but why does it output a lot of error logs ?
**How to reproduce it (as minimally and precisely as possible)**:
**Anything else we need to know?**:
**Environment**:
- Grafana version: 8.3.3
- Data source type & version: prometheus
- OS Grafana is installed on: linux
- User OS & Browser: chrome
- Grafana plugins:
- Others:
Log as follows:
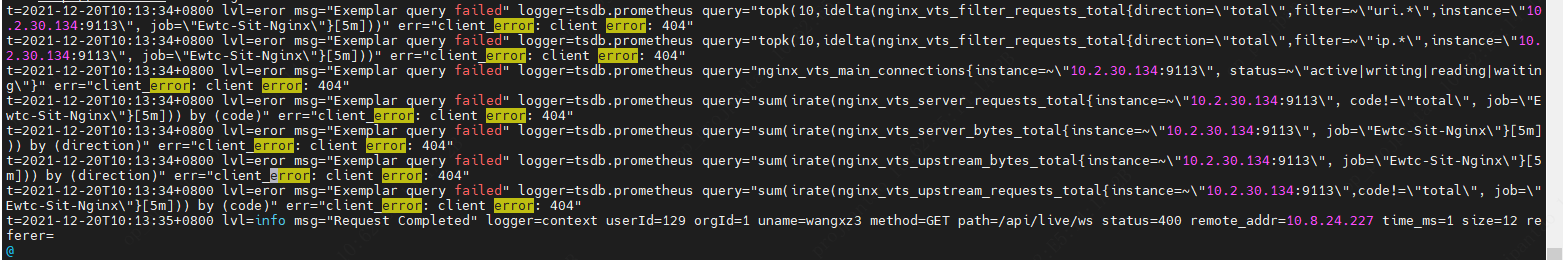
t=2021-12-20T10:13:34+0800 lvl=eror msg="Exemplar query failed" logger=tsdb.prometheus query="topk(10,idelta(nginx_vts_filter_requests_total{direction=\"total\",filter=~\"uri.*\",instance=\"10.2.30.134:9113\", job=\"Ewtc-Sit-Nginx\"}[5m]))" err="client_error: client error: 404"
t=2021-12-20T10:13:34+0800 lvl=eror msg="Exemplar query failed" logger=tsdb.prometheus query="topk(10,idelta(nginx_vts_filter_requests_total{direction=\"total\",filter=~\"ip.*\",instance=\"10.2.30.134:9113\", job=\"Ewtc-Sit-Nginx\"}[5m]))" err="client_error: client error: 404"
t=2021-12-20T10:13:34+0800 lvl=eror msg="Exemplar query failed" logger=tsdb.prometheus query="nginx_vts_main_connections{instance=~\"10.2.30.134:9113\", status=~\"active|writing|reading|waiting\"}" err="client_error: client error: 404"
t=2021-12-20T10:13:34+0800 lvl=eror msg="Exemplar query failed" logger=tsdb.prometheus query="sum(irate(nginx_vts_server_requests_total{instance=~\"10.2.30.134:9113\", code!=\"total\", job=\"Ewtc-Sit-Nginx\"}[5m])) by (code)" err="client_error: client error: 404"
t=2021-12-20T10:13:34+0800 lvl=eror msg="Exemplar query failed" logger=tsdb.prometheus query="sum(irate(nginx_vts_server_bytes_total{instance=~\"10.2.30.134:9113\", job=\"Ewtc-Sit-Nginx\"}[5m])) by (direction)" err="client_error: client error: 404"
t=2021-12-20T10:13:34+0800 lvl=eror msg="Exemplar query failed" logger=tsdb.prometheus query="sum(irate(nginx_vts_upstream_bytes_total{instance=~\"10.2.30.134:9113\", job=\"Ewtc-Sit-Nginx\"}[5m])) by (direction)" err="client_error: client error: 404"
t=2021-12-20T10:13:34+0800 lvl=eror msg="Exemplar query failed" logger=tsdb.prometheus query="sum(irate(nginx_vts_upstream_requests_total{instance=~\"10.2.30.134:9113\",code!=\"total\", job=\"Ewtc-Sit-Nginx\"}[5m])) by (code)" err="client_error: client error: 404"
t=2021-12-20T10:13:35+0800 lvl=info msg="Request Completed" logger=context userId=129 orgId=1 uname=wangxz3 method=GET path=/api/live/ws status=400 remote_addr=10.8.24.227 time_ms=1 size=12 referer=
alpiua
December 20, 2021, 8:33pm
3
It seems I’ve found a problem.
Anyway, my queries didn’t have them, but the button was enabled in the query menu.
Disabling it (making eye grey) solved the issue

