just installed loki locally on my windows computer(same as grafana runs on), and i cannot "save and test".

I just installed grafana, and am running loki with command: “loki-windows-amd64.exe --config.file=loki-config.yaml”

loki-config.yaml: #LOKIauth_enabled: falseserver: http_listen_port: 3100 #log_level: - Pastebin.com

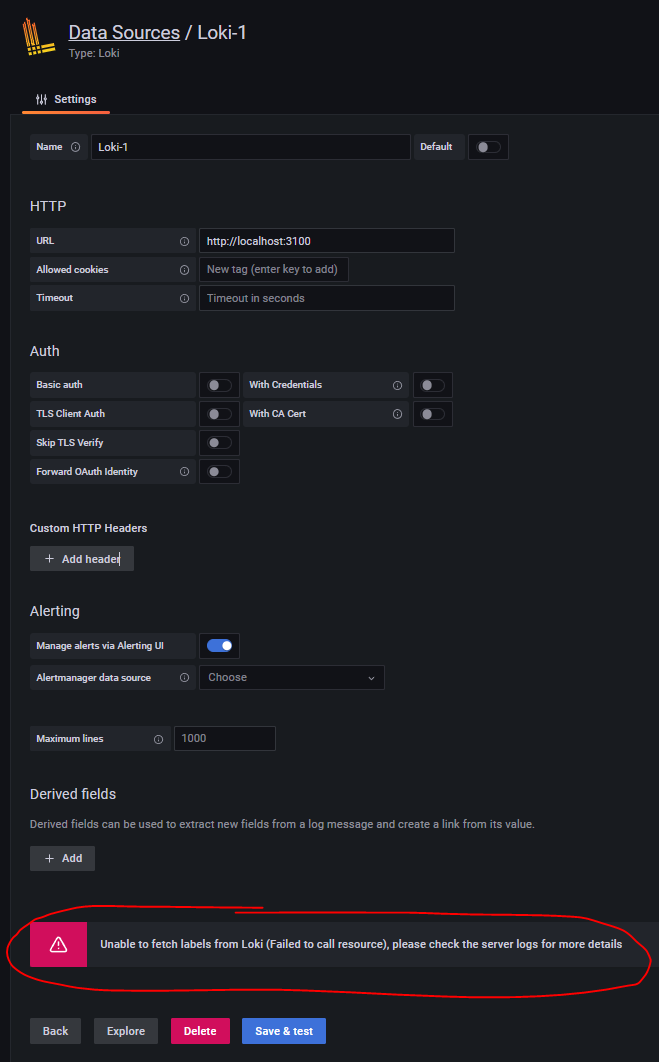
When i try to add loki in grafana, i get the following error when pressing “save & test”: “Unable to fetch labels from Loki (Failed to call resource), please check the server logs for more details”

Error messages in the loki window: ts=2022-08-22T18:04:12.0587155Z caller=spanlogger.go:80 user=fake method=query.L - Pastebin.com

Screenshot of grafana error message and input: https://usercontent.irccloud-cdn.com/file/99fYsytK/screenshot-grafana-error-message.png

Try this

      chunks_directory: /tmp/loki/chunks
      rules_directory: /tmp/loki/rules

Also is promtail needs to be running and feeding Loki.
here is my promtail config, I have a few txt files that promtail reads to push to Loki

server:
  http_listen_port: 9080
  grpc_listen_port: 0

positions:
  filename: /tmp/positions.yaml

clients:
  - url: http://localhost:3100/loki/api/v1/push

scrape_configs:
- job_name: system
  static_configs:
  - targets:
      - localhost
    labels:
      job: varlogs
      __path__: D:/lokilogs/*

Then you get this

Few leads in following url to sort out errors.

Still have the same problem.
Error messages when trying to “save & test” loki as a datasource:

If i go to http://localhost:3100/, i get “404 page not found”, which means that the loki server is running.

When i try to press “save & test”, i get the following log entries:
Grafana logs:

logger=context traceID=00000000000000000000000000000000 userId=1 orgId=1 uname=admin t=2022-12-07T15:30:46.2934775+01:00 level=error msg="Failed to call resource" error="Get \"http://localhost:3100/loki/api/v1/labels?start=1670422816283000000&end=1670423416283000000\": net/http: request canceled (Client.Timeout exceeded while awaiting headers)" traceID=00000000000000000000000000000000
logger=context traceID=00000000000000000000000000000000 userId=1 orgId=1 uname=admin t=2022-12-07T15:30:46.296726+01:00 level=error msg="Request Completed" method=GET path=/api/datasources/9/resources/labels status=500 remote_addr=127.0.0.1 time_ms=30012 duration=30.0127575s size=83 referer=http://grafana.staged-by-discourse.com/datasources/edit/YJF87QK4k traceID=00000000000000000000000000000000

Loki logs:

ts=2022-12-07T14:55:00.0223554Z caller=spanlogger.go:80 user=fake method=query.Label level=info org_id=fake latency=fast query_type=labels length=10m0s duration=566.4µs status=200 label= throughput=0B total_bytes=0B total_entries=2
level=warn ts=2022-12-07T14:55:05.7937448Z caller=pool.go:184 msg="removing frontend failing healthcheck" addr=172.29.176.1:9096 reason="rpc error: code = DeadlineExceeded desc = context deadline exceeded"
level=error ts=2022-12-07T14:55:05.7937448Z caller=scheduler_processor.go:182 org_id=fake msg="error notifying frontend about finished query" err="rpc error: code = Canceled desc = grpc: the client connection is closing" frontend=172.29.176.1:9096
level=error ts=2022-12-07T14:55:30.0319769Z caller=retry.go:73 org_id=fake msg="error processing request" try=0 err="context canceled"
level=error ts=2022-12-07T14:55:30.0319769Z caller=stats.go:57 component=frontend msg="failed to record query metrics" err="expected one of the *LokiRequest, *LokiInstantRequest, *LokiSeriesRequest, *LokiLabelNamesRequest, got "

My conclusion so far: Grafana and loki is running. Grafana can connect to loki.

How are you running loki? Straight from the exe or in docker?

Straight from exe. I don’t use docker at all.

C:\Program Files\GrafanaLabs!Loki\loki-windows-amd64.exe --config.file=loki-config.yaml

1 Like

What does it show when you run it in commamd line

Please post screen shot?

http://localhost:3100/metrics ← this page works, btw.

  1. now in the above folder, do you see a tmp folder?
  2. Aso go to http://localhost:3100/metrics and do you see some results?
  1. Content of the tmp folder:
    image

  2. screenshot of metrics:

Btw, the content of the following file is actually from the logfile on a remote server via promtail, so its actually connected …wow… C:\Program Files\GrafanaLabs!Loki\tmp\loki\wal\00000000

Also, right before i created this post, i deleted the whole tmp folder, and it populated it.

and following section of you loki config file, what does yours show?

      chunks_directory: ./tmp/loki/chunks
      rules_directory: ./tmp/loki/rules

My loki conf:

#LOKI conf

auth_enabled: false

server:
  http_listen_port: 3100
  #log_level: debug
  grpc_listen_port: 9096

common:
  path_prefix: ./tmp/loki/
  storage:
    filesystem:
      chunks_directory: ./tmp/loki/chunks
      rules_directory: ./tmp/loki/rules
  replication_factor: 1
  ring:
    instance_addr: 127.0.0.1
    kvstore:
      store: inmemory

#query_range:
#  results_cache:
#    cache:
#      embedded_cache:
#        enabled: true
#        distributed: false
#        max_size_mb: 100

schema_config:
  configs:
    - from: 2020-10-24
      store: boltdb-shipper
      object_store: filesystem
      schema: v11
      index:
        prefix: index_
        period: 24h

ruler:
  alertmanager_url: http://localhost:9093

# By default, Loki will send anonymous, but uniquely-identifiable usage and configuration
# analytics to Grafana Labs. These statistics are sent to https://stats.grafana.org/
#
# Statistics help us better understand how Loki is used, and they show us performance
# levels for most users. This helps us prioritize features and documentation.
# For more information on what's sent, look at
# https://github.com/grafana/loki/blob/main/pkg/usagestats/stats.go
# Refer to the buildReport method to see what goes into a report.
#
# If you would like to disable reporting, uncomment the following lines:
#analytics:
#  reporting_enabled: false

Btw, dont have any alertmanager setup yet.

1 Like

so in grafana you entered https here we see it works on http

You have good eyes! i tried both HTTP and HTTPS, but i found out that i got the 404 on HTTP, so i understood that i had to use HTTP.

Sorry for the missleading screenshot above.

I got the same error in grafana using HTTP.

1 Like

no lets move on to possibly networking issues
is grafana on same server as loki?

what does this mean? :eyes:

Grafana is running on my pc, same as loki. Promtail is installed on an remote server.

Regarding my conclusion: when i press “save & test”, something happens in the loki logs. The 5 lines of loki log i pasted above comes from grafana since i pressed that button. The five lines comes each time i press the button. → just installed loki locally on my windows computer(same as grafana runs on), and i cannot "save and test". - #3 by patchie

I also know that loki connects to promtail, since it fetches data from the remote server. → just installed loki locally on my windows computer(same as grafana runs on), and i cannot "save and test". - #9 by patchie

I can also add that on the same remote server running promtail, i have also “windows_exporter” installed on that server. windows_exporter sends data to prometheus(local pc, same as loki and grafana).

Just because you see folders in loki does not necessarily mean things are working. You have to do actual tests.

I think the above is where your issue is. Notice what doco says about Promtail

Promtail is an agent which ships the contents of local logs to a private Grafana Loki instance or Grafana Cloud. It is usually deployed to every machine that has applications needed to be monitored.

It is a push system. Cause I do not see anything in your Loki config, I have know to be blind often, that points to Promtail.

Let’s see your promtail config please.

I think this is how it is supposed to work. I might be wrong

in the following folder, i found files with actual log data from the server, so thats why i know it fetches data: C:\Program Files\GrafanaLabs!Loki\tmp\loki\wal\00000000

yep, the graphics you posted seems fair. I have grafana and loki on same pc, and promtail on another server.

promtail config:

#promtail config

server:
  http_listen_port: 9080
  grpc_listen_port: 0

positions:
  filename: C:\Users\****\AppData\Local\Temp\positions.yaml


clients:
  - url: http://*********:3100/loki/api/v1/push
  # The URL where Loki is listening, denoted in Loki as http_listen_address and
  # http_listen_port. If Loki is running in microservices mode, this is the HTTP
  # URL for the Distributor. Path to the push API needs to be included.
  # Example: http://example.com:3100/loki/api/v1/push


scrape_configs:
- job_name: *******-Logs
  static_configs:
  
  # Configures the discovery to look on the current machine.
  # This is required by the prometheus service discovery code but doesn't
  # really apply to Promtail which can ONLY look at files on the local machine
  # As such it should only have the value of localhost, OR it can be excluded
  # entirely and a default value of localhost will be applied by Promtail.
  - targets:
      - localhost
    
    labels:
      job: varlogs
      
      # The path to load logs from. Can use glob patterns (e.g., /var/log/*.log).
      __path__: F:\*********\standalone\log\*.log
      
      # Additional labels to assign to the logs
      # [ <labelname>: <labelvalue> ... ]
1 Like

I am out of ideas. :frowning: