grafana 5.3.x
taki
November 6, 2018, 12:44pm
2
Hi,
Br.
It’s no use.It’s already that format, not working.In the dashboard some panel work corrcet,some not.So I think it may a grafana bug
I think it’s a “feature”. See.:
opened 09:26PM - 19 Oct 18 UTC
closed 07:02AM - 26 Oct 18 UTC
type/bug
datasource/MySQL
area/datasource
### What Grafana version are you using?
Grafana v5.3.1 (08c7908)
### What … datasource are you using?
MySQL
### What OS are you running grafana on?
Ubuntu Linux 16.04
### What did you do?
I didn't really do anything. I just noticed that one of the panels on my dashboard is sort of broken - it is missing the last 2 hours of data. It was working perfectly in the previous version of Grafana (5.2.x).
The panel is a simple graph, displaying an hourly bar histogram of the data collected during the corresponding hour. So, why were the last two hours missing? I hadn't changed anything on the panel settings or in the MySQL query that feeds it the data.
Examining the generated MySQL query showed that the macro `$__timeFilter(timestamp)` had expanded to
```
timestamp BETWEEN '2018-10-18T20:19:53Z' AND '2018-10-19T20:19:53Z'
```
Here `timestamp` is a column in a table of the MySQL database with the format `datetime`. The above query was generated at 22:19 local time. My time zone is UTC+2.
Do you see what is happening? The "from" and "to" times passed to the query are in UTC time and not in local time - despite the dashboard being configured to use local time. As a result, the query fetches data for the wrong time period.
Now, I did find a workaround for the problem. Instead of using the simple `$__timeFilter(timestamp)` macro, I have to use
```
UNIX_TIMESTAMP(timestamp) BETWEEN $__unixEpochFrom() AND $__unixEpochTo()
```
This works with UTC times only and the data is fetched as it should be. It would have been more intuitive to use just `$__unixEpochFilter(UNIX_TIMESTAMP(timestamp))` but, due to the way macros are implemented, you can't pass them the result of a function instead of a simple column name. (I had opened an issue on the subject, but you closed it and didn't fix that problem, although the fix is rather trivial - I managed to figure it out despite that I don't know Go.)
Would it be possible to restore the old behavior of the `$__timeFilter()` macro? In fact, the problem probably isn't in the macro itself, but in the format of the times passed to it - they should be in local time, if the dashboard is configured to use the local time of the browser.
or
opened 12:19PM - 11 Oct 18 UTC
closed 12:34PM - 11 Oct 18 UTC
datasource/MySQL
datasource/Postgres
datasource/MSSQL
area/datasource
### What Grafana version are you using?
v.5.3.0
### What datasource are you … using?
MariaDB
Since the update, the displayed value is added one day earlier, ie "delayed", when I used the `$__timeGroup` macro.
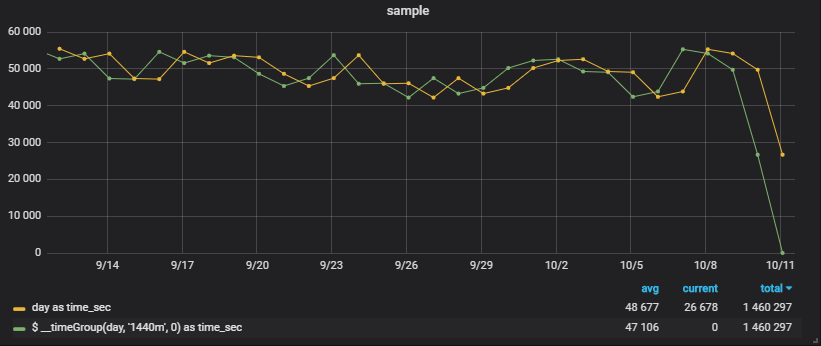
Example with **$__timeGroup(...) as time_sec**
~~~
SELECT $__timeGroup(day, '1440m', 0) as time_sec,
...
WHERE $__timeFilter(day)
...
GROUP BY time_sec
ORDER BY time_sec
~~~
Example with **day as time_sec**
~~~
SELECT day as time_sec,
...
WHERE $__timeFilter(day)
...
GROUP BY time_sec
ORDER BY time_sec
~~~
Value of series with times:

See the No.29 values of the series:
The series of the **$__timeGroup(...) as time_sec**:
~~~
time = 1539129600000 as GMT: 2018. October 10., Wednesday 0:00:00
~~~
The series of **day as time_sec**:
~~~
time = 1539216000000 as GMT: 2018. October 11., Thursday 0:00:00
~~~
My time zone:
~~~
2018. October 11., Thursday 2:00:00 GMT+02:00 DST
~~~
Setting of the "Time Option / TimeZone" of the Dashboard is "Local Browser time", but the problem with "UTC" is similar than with it.
This error did not exist in the previous 5.2.0 version.
It seem’s not the same problem.I used quick ranges last 2 days but in the Query Inspector the time range is only about last few hours.I guess the marco didn’t correctly passed to this panel
Not caused by timezone problem.The time totally wrong
