A was able to reproduce this issue also on https://play.grafana.org/ in “InfluxDB Templated” dashboard, so I attach here panel JSON.
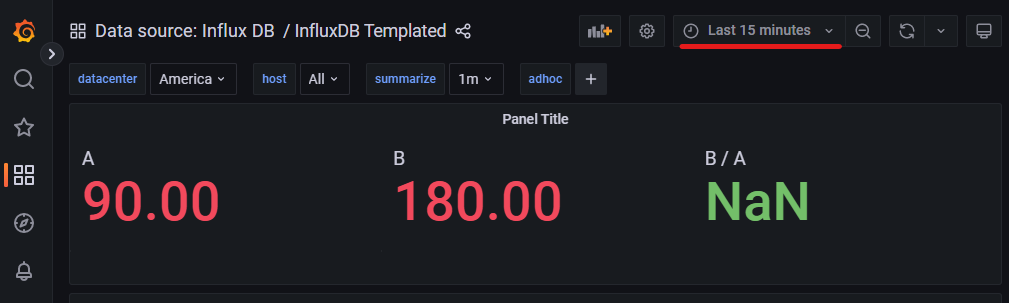
When I select “Last 15 minutes” panel returns “NaN” from B/A operation.
When I select “Yesterday” panel returns correct number value from B/A operation.

{ "id": 3, "gridPos": { "x": 0, "y": 0, "w": 24, "h": 5 }, "type": "stat", "title": "Panel Title", "targets": [ { "refId": "A", "datasource": { "type": "influxdb", "uid": "000000002" }, "policy": "default", "resultFormat": "time_series", "orderByTime": "ASC", "tags": [ { "key": "hostname", "value": "server1", "operator": "=" } ], "groupBy": [], "select": [ [ { "type": "field", "params": [ "value" ] }, { "type": "count", "params": [] } ] ], "measurement": "cpu", "alias": "A" }, { "refId": "B", "datasource": { "type": "influxdb", "uid": "000000002" }, "policy": "default", "resultFormat": "time_series", "orderByTime": "ASC", "tags": [ { "key": "hostname", "value": "server2", "operator": "=" } ], "groupBy": [], "select": [ [ { "type": "field", "params": [ "value" ] }, { "type": "count", "params": [] } ] ], "measurement": "cpu", "hide": false, "alias": "B" } ], "options": { "reduceOptions": { "values": false, "calcs": [ "lastNotNull" ], "fields": "" }, "orientation": "auto", "textMode": "auto", "colorMode": "value", "graphMode": "area", "justifyMode": "auto" }, "fieldConfig": { "defaults": { "mappings": [], "thresholds": { "mode": "absolute", "steps": [ { "value": null, "color": "green" }, { "value": 80, "color": "red" } ] }, "color": { "mode": "thresholds" }, "decimals": 2 }, "overrides": [] }, "datasource": { "uid": "000000002", "type": "influxdb" }, "pluginVersion": "9.1.3-e1f2f3c", "transformations": [ { "id": "calculateField", "options": { "mode": "binary", "reduce": { "reducer": "sum" }, "binary": { "operator": "/", "reducer": "sum", "left": "B", "right": "A" } } } ] }


