Hi to all,
I am new to grafana and I have two questions.
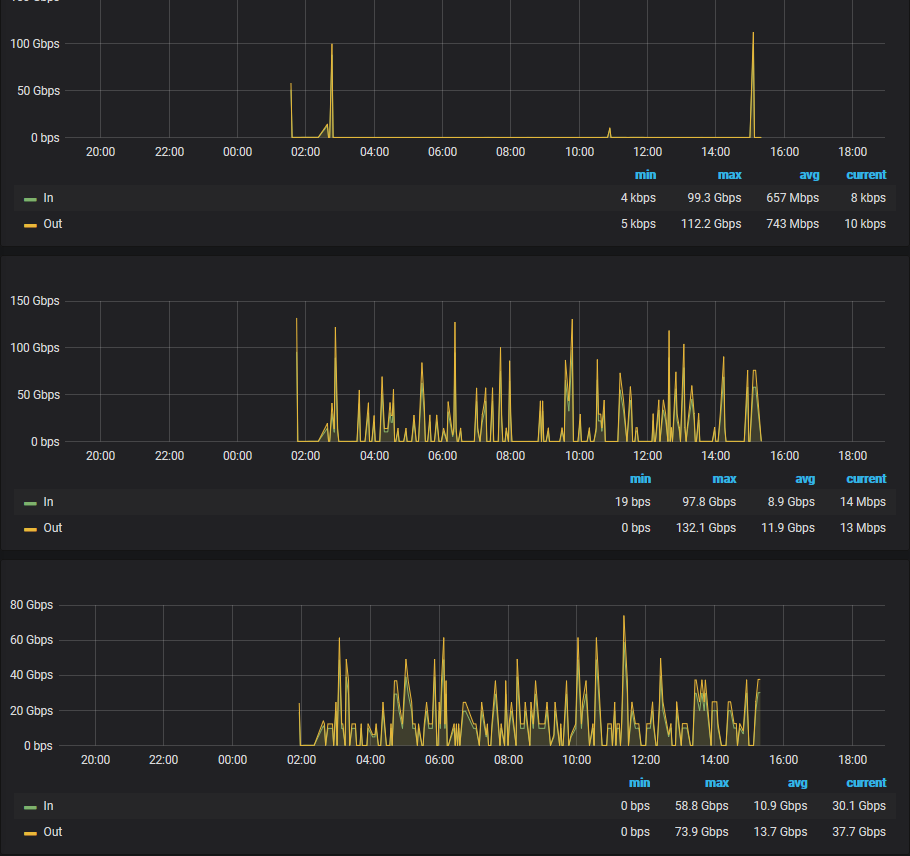
I setup influxdb and grafana on one server and after that i set collectd on the other 3 servers. I want to graph bandwidth from those 3 servers. But when I set that, I get some strange and wrong values. those three servers have 10 gbe card [both of 10gbe ports on that cards are in lacp bond]. I get 132 gbps??
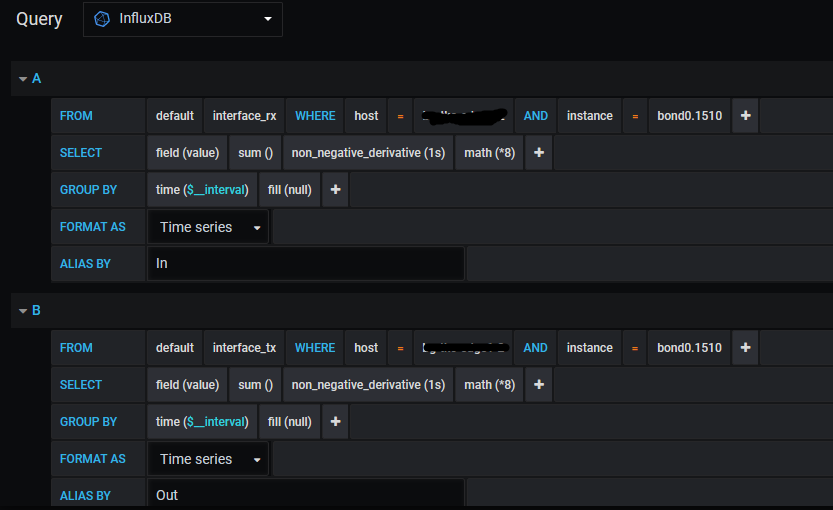
My settings for those pannels are:
*SELECT non_negative_derivative(sum(“value”), 1s) *8 FROM “interface_rx” WHERE (“host” = ‘server1’ AND “instance” = ‘bond0.1510’) AND timeFilter GROUP BY time(__interval) fill(null)
SELECT non_negative_derivative(sum(“value”), 1s) 8 FROM “interface_tx” WHERE (“host” = ‘server1’ AND “instance” = ‘bond0.1510’) AND timeFilter GROUP BY time(__interval) fill(null)
Metric -> bits per seconds
I tried with mean and sum but its the same result. Also, I tried with FROM “network_rx/tx”, same problem. How can I get true values? What I am doing wrong?
2.Firewalld problem.
Influxdb
[[collectd]]
enabled = true
bind-address = “:8096”
database = “collectd”
typesdb = “/usr/share/collectd/types.db”
Collectd
Plugin network
Server “server_ip” “8096”
Plugin
Firewalld:
[root@ce ~]# firewall-offline-cmd --zone=public --list-services
http https ssh
[root@ce ~]# firewall-offline-cmd --zone=public --list-all
public
target: default
icmp-block-inversion: no
interfaces:
sources:
services: http https ssh
ports: 32400/tcp 8181/tcp 8086/tcp 53535/tcp 8096/tcp 25826/tcp
protocols:
masquerade: no
forward-ports:
source-ports:
icmp-blocks:
rich rules:
When firewalld is stopped, everything working, when I start it, collectd fails to get to influxdb. What is wrong with this configuration?
I didnt find similar problem here, that is why i opened this.
Regards.


