Hi, I have problems using that plugin in combination with Nodered.
It wouldt be VERY helpful, if an easy example can be provided.
- What Grafana version and what operating system are you using?
logger=settings t=2023-07-20T09:47:18.285556648+02:00 level=info msg=“Starting Grafana” version=10.0.2
Add-on: Grafana
The open platform for beautiful analytics and monitoring
Add-on version: 9.0.2
You are running the latest version of this add-on.
System: Home Assistant OS 9.5 (aarch64 / raspberrypi4-64)
Home Assistant Core: 2023.3.3
Home Assistant Supervisor: 2023.07.1
- What are you trying to achieve?
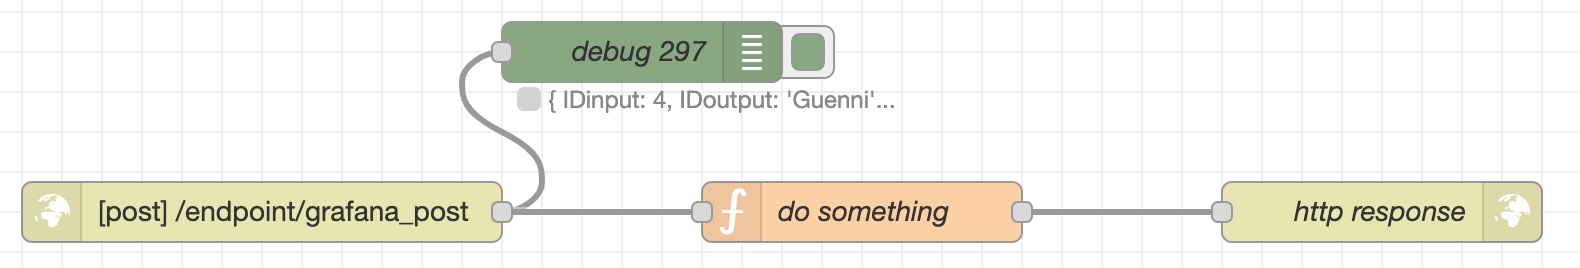
I like to use the Data Manipulation plugin to communicate with Nodered
- How are you trying to achieve it?
I tried to use an url like http://homeassistant-test.fritz.box:1880/endpoint/grafana with a POST request to address Nodered Node type “http in”
- What happened?
Getting no data in Nodered
- What did you expect to happen?
Getting data in Nodered at the /endpoint/grafana
-
Can you copy/paste the configuration(s) that you are having problems with?
-
Did you receive any errors in the Grafana UI or in related logs? If so, please tell us exactly what they were.
seeing 404 in Chrome console
- Did you follow any online instructions? If so, what is the URL?