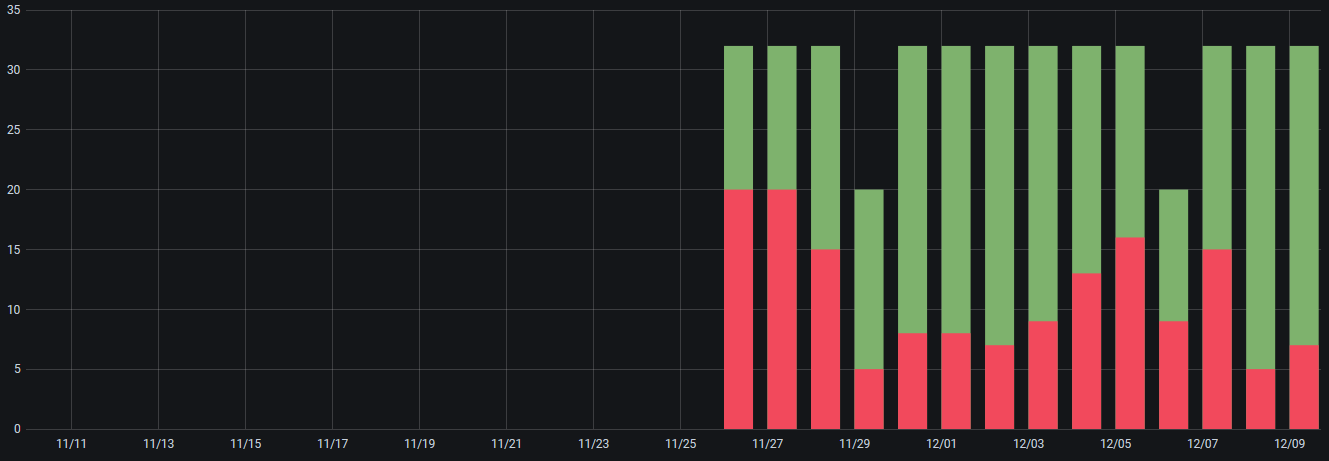
I try to create a graph panel based on daily data with 2 queries. 1st query is the total sum per day and the 2nd query is a part of that. If I select 1 value of my variable dropdown list everything looks as expected:
But if I select a 2nd (or 3rd, …) value of the variable dropdown the whole graph is crashed:

In both options the result of the queries are the same:
Date in time format, value 1 integer, value 2 integer
In both cases there is one row for each day.
For me it feels like the queries are fine but the panel settings are wrong. Can you assist where the wrong setting is hiding?